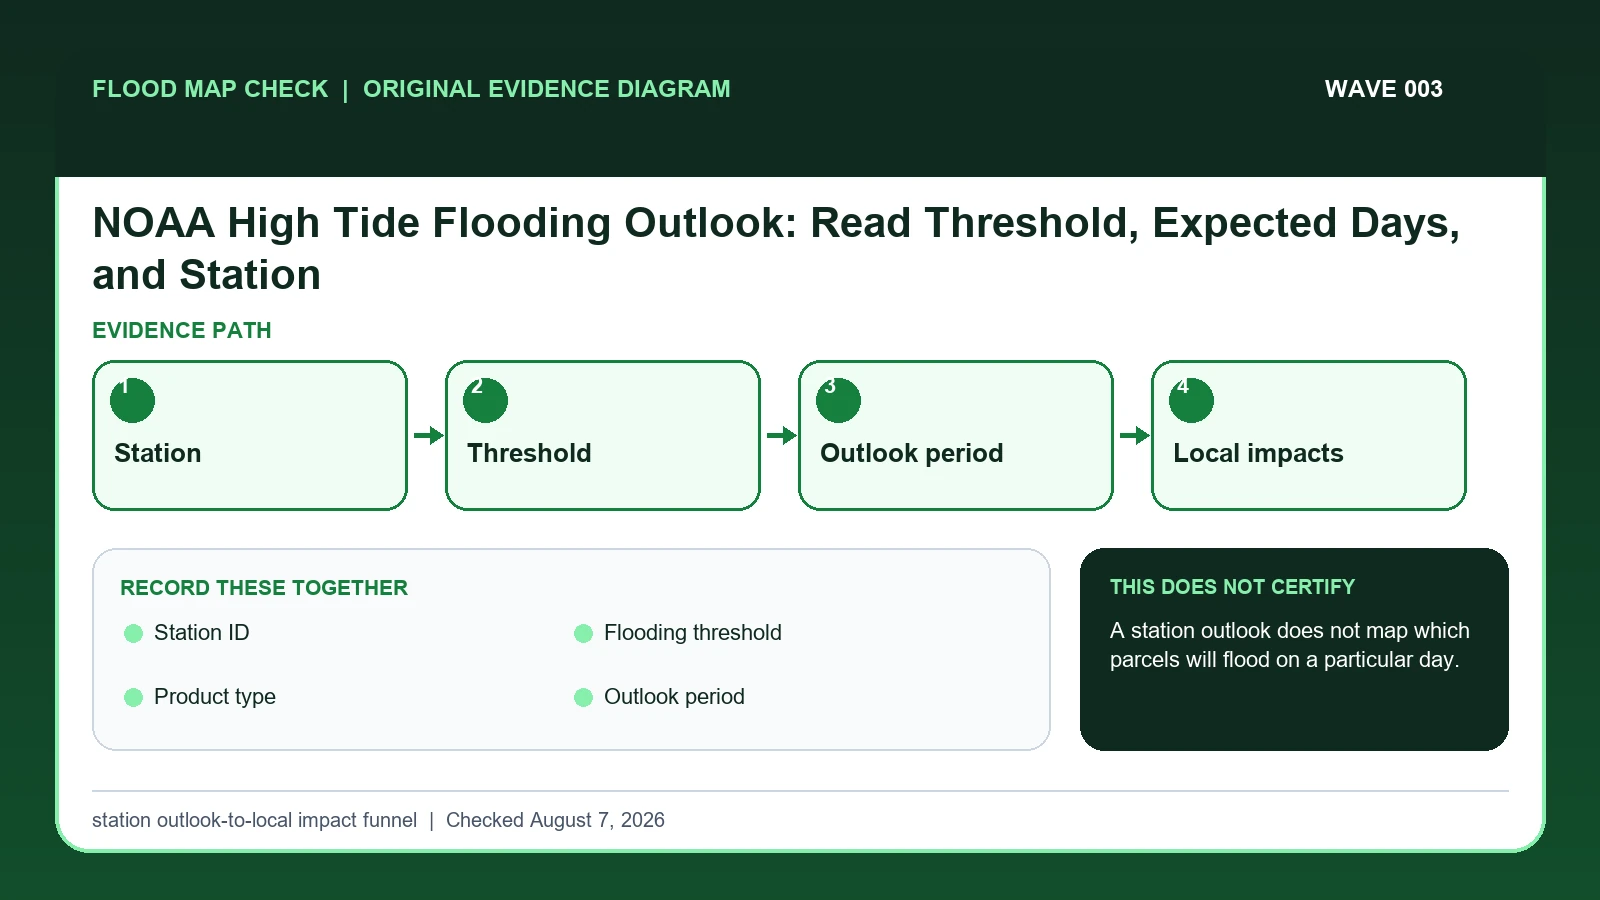
NOAA high-tide flooding outlooks estimate the number or timing of threshold exceedance days at specific tide stations. Match the station ID, local flooding threshold, annual or monthly product, outlook period, and uncertainty; the result does not identify which parcel or road will flood on a particular day.
Last checked: August 7, 2026.
The annual outlook addresses a meteorological year from May through April and can include a predicted range of high-tide flooding days plus longer-term context. The monthly outlook highlights dates with elevated likelihood at a station. These products are station-threshold planning tools. Wind, waves, rainfall, drainage, and local topography can increase or reduce impacts compared with the tide-only expectation.
A range of flooding days is not an event calendar
NOAA's high-tide flooding outlook is a station-based planning product that estimates likely flooding days over monthly or annual periods. It is not a day-specific tide forecast, storm-surge warning, or parcel inundation map. The station, threshold definition, outlook period, observed history, and release date are essential because local tidal range, land motion, weather, and infrastructure affect what a flooding day means.
If an annual outlook gives a range of 12 to 18 high-tide flooding days, the midpoint is 15, but that midpoint is only a convenient summary of the stated range. It does not schedule 15 events or assign equal probability to every date. A monthly outlook can narrow seasonal attention, yet operational planning still requires the current tide prediction, weather forecast, coastal flood products, and local impact information.
Station coverage is another limit. The nearest tide gauge may sit across a bay, behind a barrier, or in a different hydraulic setting. A community can experience drainage or wave problems that are not represented by the station threshold. Preserve the local station name and threshold rather than transferring the count to an address. Regulatory elevation, insurance, and building questions remain with FIRMs, surveys, and community standards, not the outlook.
NOAA's station outlook is a planning product
NOAA High Tide Flooding supplies annual and monthly station outlooks, definitions, and planning limits; this guide cites it for Station ID / Flooding threshold / Product type / Outlook period / Expected range/likelihood. NOAA sea level and coastal flooding information supplies station observations, trends, high-tide flooding, extreme water levels, and coastal tools; this guide cites it for Station ID / Flooding threshold / Outlook period / Expected range/likelihood. NOAA relative sea level trends supplies station trend, record length, local relative reference, and confidence information; this guide cites it for Station ID.
The NOAA high tide flooding outlook crosswalk keeps these assignments explicit: NOAA High Tide Flooding → Station ID / Flooding threshold / Product type / Outlook period / Expected range/likelihood; NOAA sea level and coastal flooding information → Station ID / Flooding threshold / Outlook period / Expected range/likelihood; NOAA relative sea level trends → Station ID. If Station ID or another named field is absent from its cited record, leave that fact unresolved and obtain it from the responsible official source instead of expanding a different citation beyond scope.
| Official record | What it actually supplies | Field used here |
|---|---|---|
| NOAA High Tide Flooding | annual and monthly station outlooks, definitions, and planning limits | Station ID / Flooding threshold / Product type / Outlook period / Expected range/likelihood |
| NOAA sea level and coastal flooding information | station observations, trends, high-tide flooding, extreme water levels, and coastal tools | Station ID / Flooding threshold / Outlook period / Expected range/likelihood |
| NOAA relative sea level trends | station trend, record length, local relative reference, and confidence information | Station ID |
Use the cited records only to translate station-based annual outlooks into properly scoped planning evidence. If an official page no longer publishes Station ID, save its URL and checked date, mark that fact unavailable, and ask the agency or data owner rather than borrowing it from a secondary summary.
The relative sea-level trend page supplies station and long-term planning context only; it does not establish the outlook days or their expected range.
How Station ID connects to Expected range/likelihood
| Field | Meaning in this check | Error it exposes | Response |
|---|---|---|---|
| Station ID | Location controlling the outlook | Nearest is not always representative | Keep name, ID, and map position |
| Flooding threshold | Local water level used for exceedance | Threshold differs by station | Record datum and units |
| Product type | Annual count/range or monthly dates | Answers different planning questions | Label clearly |
| Outlook period | May-April year or displayed month/year | Not a timeless forecast | Save issue and validity dates |
| Expected range/likelihood | Statistical outlook output | Not certainty for a street | Carry uncertainty and local modifiers |
Begin with Station ID, which answers “Location controlling the outlook”. Check Flooding threshold separately because it answers “Local water level used for exceedance”. If the record instead shows “Threshold differs by station”, use the stated correction: “Record datum and units”.
Product type can change the interpretation because it answers “Annual count/range or monthly dates”. Its main warning is “Answers different planning questions”. Read that warning beside Outlook period so place, period, unit, and reference remain attached to the same evidence.
Finish the comparison with Expected range/likelihood. It answers “Statistical outlook output”, while “Not certainty for a street” marks the point where a broader conclusion would be unsafe. When that condition appears, follow “Carry uncertainty and local modifiers” and leave the larger decision open.
Carry station, threshold, period, and release date
Build the evidence from Station ID outward. The middle of the review should move from “Distinguish annual and monthly outlook products and copy the correct validity period” to “Record the predicted range or likelihood exactly, including uncertainty language”. Record any conflict before continuing to the remaining checks.
- Choose the tide station by coastal setting rather than straight-line distance alone.
- Open its threshold and datum information before reading an outlook count or date.
- Distinguish annual and monthly outlook products and copy the correct validity period.
- Record the predicted range or likelihood exactly, including uncertainty language.
- Check observed water levels, weather, waves, rain, and local drainage near the date of concern.
- Use local road, emergency, harbor, and property guidance for actual impacts.
- Archive the station evidence and recheck when NOAA issues a new outlook.
After the comparison, “Archive the station evidence and recheck when NOAA issues a new outlook”. The saved evidence should let another reader retrace Station ID through Product type without guessing which limitation applied.
Why a 12-to-18-day range is not a tide calendar
A station outlook showing several likely threshold days does not mean every waterfront street will flood on each date. Record the station and threshold, then use local inundation dashboards, forecasts, road notices, and drainage context as the date approaches. If the nearest station is across a bay or inlet, explain why it is hydrodynamically relevant before transferring the signal.
In this example, Station ID identifies the relevant record, while Product type is the fact most likely to change the interpretation. Conclude “Seasonal workload context” only when the evidence shows “Expected range of threshold days”.
For NOAA high tide flooding outlook, if the facts instead fit “Compound conditions”, the result changes to “Impact may exceed tide-only signal”. Respond by following “Follow local forecasts and emergency management”. Do not substitute the more favorable conclusion from the earlier example.
Annual range, monthly signal, current event, and station gap
| Observed state | Evidence test | Limited conclusion | Next response |
|---|---|---|---|
| Annual planning | Expected range of threshold days | Seasonal workload context | Plan monitoring and mitigations |
| Monthly date window | Higher likelihood around specified tides | Not deterministic | Check short-term weather and local notices |
| Station mismatch | Different water body or exposure | Transfer is unsupported | Find a representative station or state the gap |
| Compound conditions | Rain, wind, waves, drainage coincide | Impact may exceed tide-only signal | Follow local forecasts and emergency management |
When the evidence shows “Expected range of threshold days”, the limited conclusion is “Seasonal workload context” and the next action is “Plan monitoring and mitigations”. By contrast, “Monthly date window” requires “Check short-term weather and local notices” because its evidence test is “Higher likelihood around specified tides”.
For “Station mismatch”, use “Find a representative station or state the gap”. For “Compound conditions”, use “Follow local forecasts and emergency management”. Across Station mismatch and Compound conditions, neither branch permits an unsupported favorable conclusion when the stated evidence is absent.
Distant gauges and impacts the outlook does not map
- Avoid using the closest station without checking setting. Recheck Station ID. The mapped warning is “Nearest is not always representative”; the corresponding response is “Keep name, ID, and map position”.
- Avoid calling an outlook a warning. Recheck Product type. The mapped warning is “Answers different planning questions”; the corresponding response is “Label clearly”.
- Avoid mapping station days to parcels. Recheck Expected range/likelihood. The mapped warning is “Not certainty for a street”; the corresponding response is “Carry uncertainty and local modifiers”.
- Avoid ignoring compound rainfall and wind. Recheck Expected range/likelihood. The mapped warning is “Not certainty for a street”; the corresponding response is “Carry uncertainty and local modifiers”.
Check Station ID when the risk is “using the closest station without checking setting”, because the mapped warning is “Nearest is not always representative”. Check Product type separately for “calling an outlook a warning” and use “Label clearly” as the recovery step.
Two field-specific corrections are required. For “mapping station days to parcels”, follow “Carry uncertainty and local modifiers”. For “ignoring compound rainfall and wind”, follow “Carry uncertainty and local modifiers”. Keeping Expected range/likelihood separate from Expected range/likelihood prevents one repaired field from hiding the other error.
What this station outlook-to-local impact funnel cannot decide
Scope: United States coastal screening and observed water levels. Limitation: A station outlook does not map which parcels will flood on a particular day.
The station outlook-to-local impact funnel keeps Station ID, Product type, and Expected range/likelihood in one comparison; it does not translate station-based annual outlooks into properly scoped planning evidence on the reader’s behalf. If the facts match “Compound conditions”, follow “Follow local forecasts and emergency management” with the responsible agency or professional.
Move from planning outlook to operational coastal products
- After confirming Station ID, continue to Coastal Flood Map Check only for the separate question named there.
- Use NOAA Sea Level Rise Viewer Address Guide when Product type raises an issue outside this article’s evidence test.
- Open Coastal A Zone LiMWA Lookup if Expected range/likelihood requires a broader official-record review.
Use this guide to translate station-based annual outlooks into properly scoped planning evidence. The linked guides address separate questions raised by Station ID, Product type, or Expected range/likelihood.
Before applying an outlook count beyond its station
Does Station ID settle the question by itself?
No. Station ID answers “Location controlling the outlook”, but it can fail when “Nearest is not always representative”. Pair it with Flooding threshold, Product type, and the checked date.
What if the evidence shows Compound conditions?
Confirm the stated evidence test: “Rain, wind, waves, drainage coincide”. The limited conclusion is “Impact may exceed tide-only signal”. The documented response is “Follow local forecasts and emergency management”; a more favorable branch should not be substituted.
When should Expected range/likelihood be checked again?
Use the newest NOAA annual or monthly outlook, station threshold, and release date for planning. Switch to current tide forecasts, coastal flood statements, and local instructions for a near-term event; the outlook count does not become a dated event schedule.
NOAA High Tide Flooding Outlook: Read Threshold, Expected Days, and Station is independent public-record guidance for the limited action to translate station-based annual outlooks into properly scoped planning evidence. The cited government records retain authority over Station ID and Expected range/likelihood. Last checked: August 7, 2026.