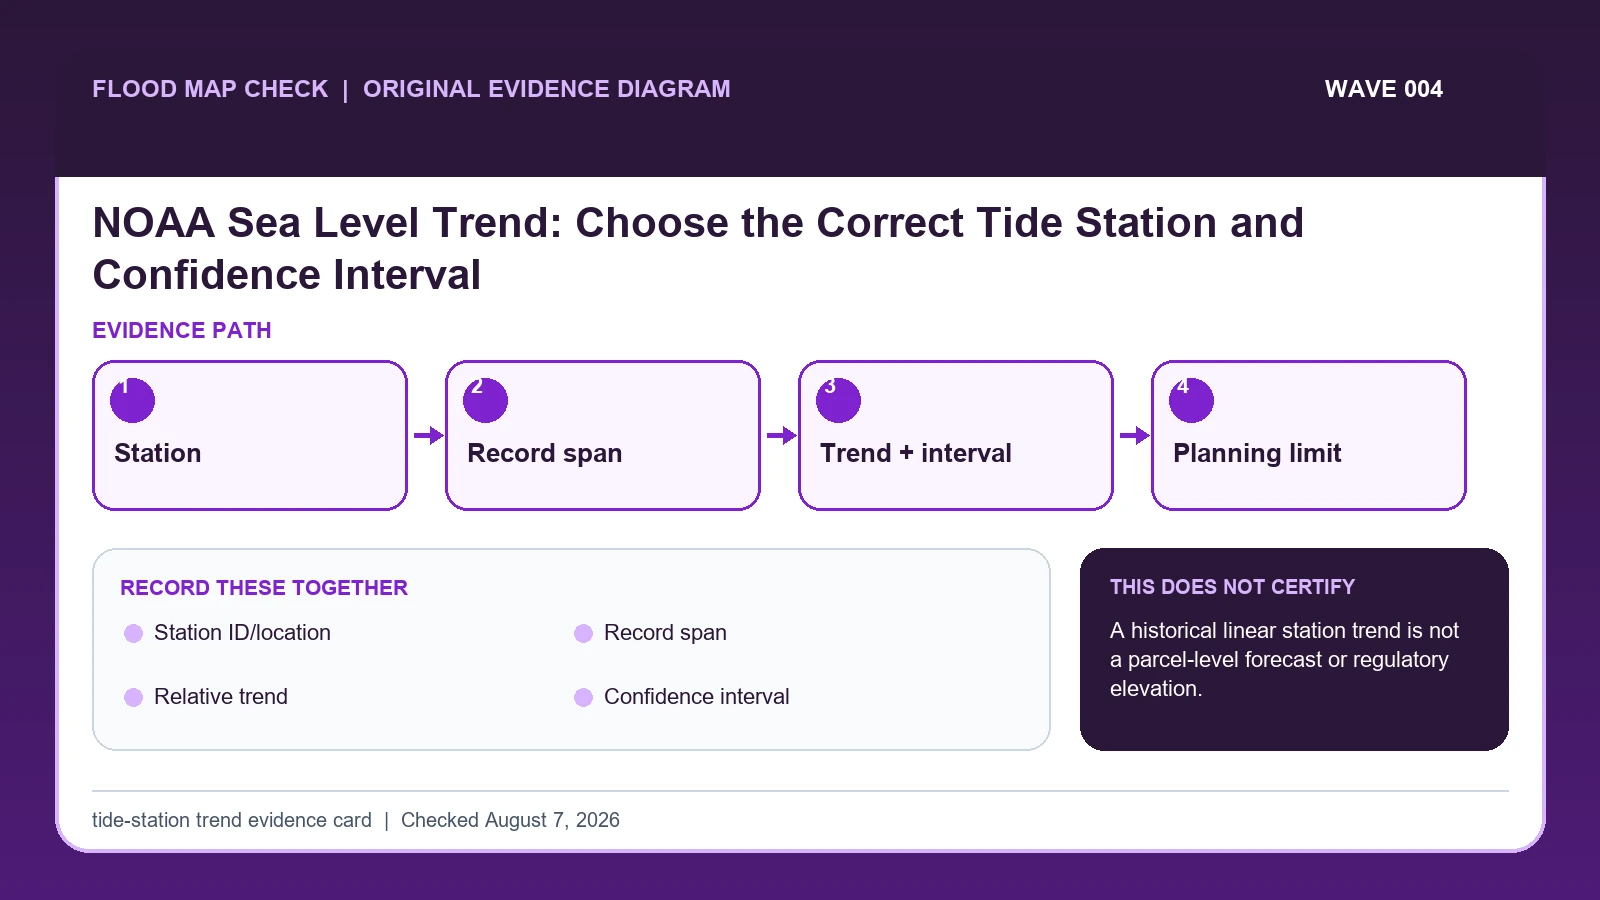
Use a NOAA relative sea-level trend only after matching the station, record span, units, confidence interval, update date, and local coastal setting. Cite the station ID and data gaps with the result; a historical linear trend is not a parcel flood-depth forecast or regulatory elevation.
Last checked: August 7, 2026.
Relative sea level combines change in the water surface with vertical land motion at the station. That is why two nearby regions can show different trends. NOAA computes long-term station trends from monthly water-level observations and presents uncertainty around the estimated rate. A global satellite trend or distant harbor station cannot substitute for the local station without an explicit scientific reason.
Relative trend is local and linear projection is conditional
NOAA relative sea-level trends describe the change of sea level relative to the land and benchmark system at a particular tide station. The published slope, record span, and confidence interval travel together. A value in millimeters per year can include both ocean change and local vertical land motion; it should not be described as a universal global-ocean rate or transferred to another harbor without evidence.
A simple projection illustrates the arithmetic but not a forecast. A station trend of 3.2 millimeters per year multiplied by 30 years equals 96 millimeters, or about 9.6 centimeters, if the historical linear rate were to continue. The confidence interval and nonlinearity of future conditions still matter, and the result does not include a particular storm tide, waves, subsidence scenario, or building elevation.
Record length and datum context can change how stable a trend appears. Short or interrupted records generally provide less constraint than long, well-maintained series. A nearby station may have a different land-motion signal. Use the trend for station-scale historical context, NOAA scenarios for scenario work, operational products for an event, and FEMA or local products for regulatory decisions. Keeping those roles separate prevents a trend line from becoming a parcel flood prediction.
NOAA's station trend page supplies rate and confidence
NOAA relative sea level trends supplies station trend, record length, local relative reference, and confidence information; this guide cites it for Station ID/location / Record span / Relative trend / Confidence interval / Update/data gaps. NOAA sea level and coastal flooding information supplies station observations, trends, high-tide flooding, extreme water levels, and coastal tools; this guide cites it for Station ID/location / Relative trend / Update/data gaps. NOAA High Tide Flooding supplies annual and monthly station outlooks, definitions, and planning limits; this guide cites it for Station ID/location.
The NOAA sea level trend station crosswalk keeps these assignments explicit: NOAA relative sea level trends → Station ID/location / Record span / Relative trend / Confidence interval / Update/data gaps; NOAA sea level and coastal flooding information → Station ID/location / Relative trend / Update/data gaps; NOAA High Tide Flooding → Station ID/location. If Station ID/location or another named field is absent from its cited record, leave that fact unresolved and obtain it from the responsible official source instead of expanding a different citation beyond scope.
| Official record | What it actually supplies | Field used here |
|---|---|---|
| NOAA relative sea level trends | station trend, record length, local relative reference, and confidence information | Station ID/location / Record span / Relative trend / Confidence interval / Update/data gaps |
| NOAA sea level and coastal flooding information | station observations, trends, high-tide flooding, extreme water levels, and coastal tools | Station ID/location / Relative trend / Update/data gaps |
| NOAA High Tide Flooding | annual and monthly station outlooks, definitions, and planning limits | Station ID/location |
Do not extend a citation beyond its mapped fields. Evidence for Station ID/location cannot automatically establish Update/data gaps; keep either unanswered item visible before taking the action to select and cite a station trend with its uncertainty and record length.
High-tide-flooding material supplies planning context only; it does not replace the station trend estimate or confidence interval.
How Station ID/location connects to Update/data gaps
| Field | Meaning in this check | Error it exposes | Response |
|---|---|---|---|
| Station ID/location | Controls the observed record | Nearby coastlines can behave differently | Explain station choice |
| Record span | Years/months used in trend | Short/gappy record raises uncertainty | Cite start/end |
| Relative trend | Long-term station rate combining local water-level change and vertical land motion | It is neither a global-only rate nor a parcel flood-depth forecast from a straight-line extension | Report the station rate, units, and confidence; use suitable flood scenarios and local elevation evidence for parcel depth |
| Confidence interval | Uncertainty around rate | Point estimate is not exact | Report with trend |
| Update/data gaps | Freshness and completeness | Trend can be revised | Save checked date |
Station ID/location is the starting identifier, but it is usable only when Record span and Relative trend agree. Two conflicts can break that agreement: “Nearby coastlines can behave differently” and “It is neither a global-only rate nor a parcel flood-depth forecast from a straight-line extension”. A polished screenshot cannot repair either one.
For interpretation, Record span answers “Years/months used in trend”, while Confidence interval answers “Uncertainty around rate”. They are not interchangeable. A failure in the first calls for “Cite start/end”; a failure in the second calls for “Report with trend”.
The final safeguard is Update/data gaps, which answers “Freshness and completeness”. Its warning condition is “Trend can be revised”. At that point in the NOAA sea level trend station check, document the limited result or take the unresolved issue to the official decision owner.
Keep station, record span, slope, and interval together
Treat “Record observation span, trend units, estimate, confidence interval, and update date” as a prerequisite for “Read station notes and identify material gaps or datum issues”. Together they determine whether Relative trend belongs to the same subject, period, and official product as Station ID/location.
- Map candidate NOAA tide stations and identify the one representing the relevant water body and exposure.
- Open the station trend page and copy the station ID and complete location name.
- Record observation span, trend units, estimate, confidence interval, and update date.
- Read station notes and identify material gaps or datum issues.
- Describe the value as local relative sea-level trend rather than global sea-level rise.
- For future risk, combine the historical trend with official scenarios, extremes, and local elevation/drainage evidence.
- Archive the citation and recheck when NOAA updates the station analysis.
Do not close the file at the first plausible result. Carry out “Archive the citation and recheck when NOAA updates the station analysis”, then preserve the version of Update/data gaps that was current on the checked date.
Projecting a local trend without calling it a forecast
If one station shows a positive millimeters-per-year trend, do not multiply it by the life of a mortgage and call the result the exact future flood depth. Linear extrapolation omits scenario uncertainty, extremes, local topography, drainage, waves, and adaptation. Use the trend as observed historical context alongside NOAA scenarios and local planning data.
In this example, Station ID/location identifies the relevant record, while Relative trend is the fact most likely to change the interpretation. Conclude “Strong historical context” only when the evidence shows “Coastal setting and record support use”.
For NOAA sea level trend station, if the facts instead fit “Future planning”, the result changes to “Trend alone insufficient”. Respond by following “Add NOAA scenarios and local data”. Do not substitute the more favorable conclusion from the earlier example.
Historical slope, confidence interval, transferred station, and future scenario
| Observed state | Evidence test | Limited conclusion | Next response |
|---|---|---|---|
| Relevant long-term station | Coastal setting and record support use | Strong historical context | Cite trend and interval |
| Distant/different basin | Hydrodynamic or land-motion mismatch | Transfer is weak | Find better station or disclose limit |
| Short or gappy record | Large uncertainty | Trend is less stable | Avoid precise extrapolation |
| Future planning | Need scenarios/extremes | Trend alone insufficient | Add NOAA scenarios and local data |
The first decision turns on “Coastal setting and record support use”, while the next turns on “Hydrodynamic or land-motion mismatch”. Those tests lead to different conclusions—“Strong historical context” and “Transfer is weak”—so they should remain separate in the saved record.
“Short or gappy record” calls for “Avoid precise extrapolation”, but “Future planning” calls for “Add NOAA scenarios and local data”. Reporting the Short or gappy record and Future planning differences is more accurate than forcing both conditions into one generalized warning.
Short records, land motion, and transferred harbor rates
- Avoid choosing by distance only. Recheck Station ID/location. The mapped warning is “Nearby coastlines can behave differently”; the corresponding response is “Explain station choice”.
- Avoid dropping the confidence interval. Recheck Confidence interval. The mapped warning is “Point estimate is not exact”; the corresponding response is “Report with trend”.
- Avoid calling relative trend global. Recheck Relative trend. The mapped warning is “It is neither a global-only rate nor a parcel flood-depth forecast from a straight-line extension”; the corresponding response is “Report the station rate, units, and confidence; use suitable flood scenarios and local elevation evidence for parcel depth”.
- Avoid turning linear trend into parcel depth. Recheck Relative trend. The mapped warning is “It is neither a global-only rate nor a parcel flood-depth forecast from a straight-line extension”; the corresponding response is “Report the station rate, units, and confidence; use suitable flood scenarios and local elevation evidence for parcel depth”.
The remedy for “choosing by distance only” is tied to Station ID/location: “Explain station choice”. The separate mistake “dropping the confidence interval” is exposed by “Point estimate is not exact”; answer it with “Report with trend”.
Check Relative trend when the risk is “calling relative trend global”, because the mapped warning is “It is neither a global-only rate nor a parcel flood-depth forecast from a straight-line extension”. Check Relative trend separately for “turning linear trend into parcel depth” and use “Report the station rate, units, and confidence; use suitable flood scenarios and local elevation evidence for parcel depth” as the recovery step.
What this tide-station trend evidence card cannot decide
Scope: United States coastal screening and observed water levels. Limitation: A historical linear station trend is not a parcel-level forecast or regulatory elevation.
The value of the tide-station trend evidence card is traceability: it places Station ID/location, Relative trend, and Update/data gaps beside their sources. Authority to decide the underlying Station ID/location remains with the organization named in the official record.
Keep trend, tide, surge, and regulatory checks distinct
- Consult Coastal Flood Map Check after Station ID/location has been matched to the correct subject and date.
- Consult NOAA Sea Level Rise Viewer Address Guide for the distinct issue revealed by Relative trend.
- Consult Coastal A Zone LiMWA Lookup when Update/data gaps changes the next official step beyond the action to select and cite a station trend with its uncertainty and record length.
Use this guide to select and cite a station trend with its uncertainty and record length. The linked guides address separate questions raised by Station ID/location, Relative trend, or Update/data gaps.
Before extending a NOAA station trend
Does Station ID/location settle the question by itself?
No. Station ID/location answers “Controls the observed record”, but it can fail when “Nearby coastlines can behave differently”. Pair it with Record span, Relative trend, and the checked date.
What if the evidence shows Future planning?
Confirm the stated evidence test: “Need scenarios/extremes”. The limited conclusion is “Trend alone insufficient”. The documented response is “Add NOAA scenarios and local data”; a more favorable branch should not be substituted.
When should Update/data gaps be checked again?
Use the station trend page again when NOAA extends the record, revises the trend or confidence interval, changes the datum or epoch context, or updates station-quality information. Recalculate any linear illustration from the new slope and state that it remains a scenario, not a forecast.
NOAA Sea Level Trend: Choose the Correct Tide Station and Confidence Interval is independent public-record guidance for the limited action to select and cite a station trend with its uncertainty and record length. The cited government records retain authority over Station ID/location and Update/data gaps. Last checked: August 7, 2026.