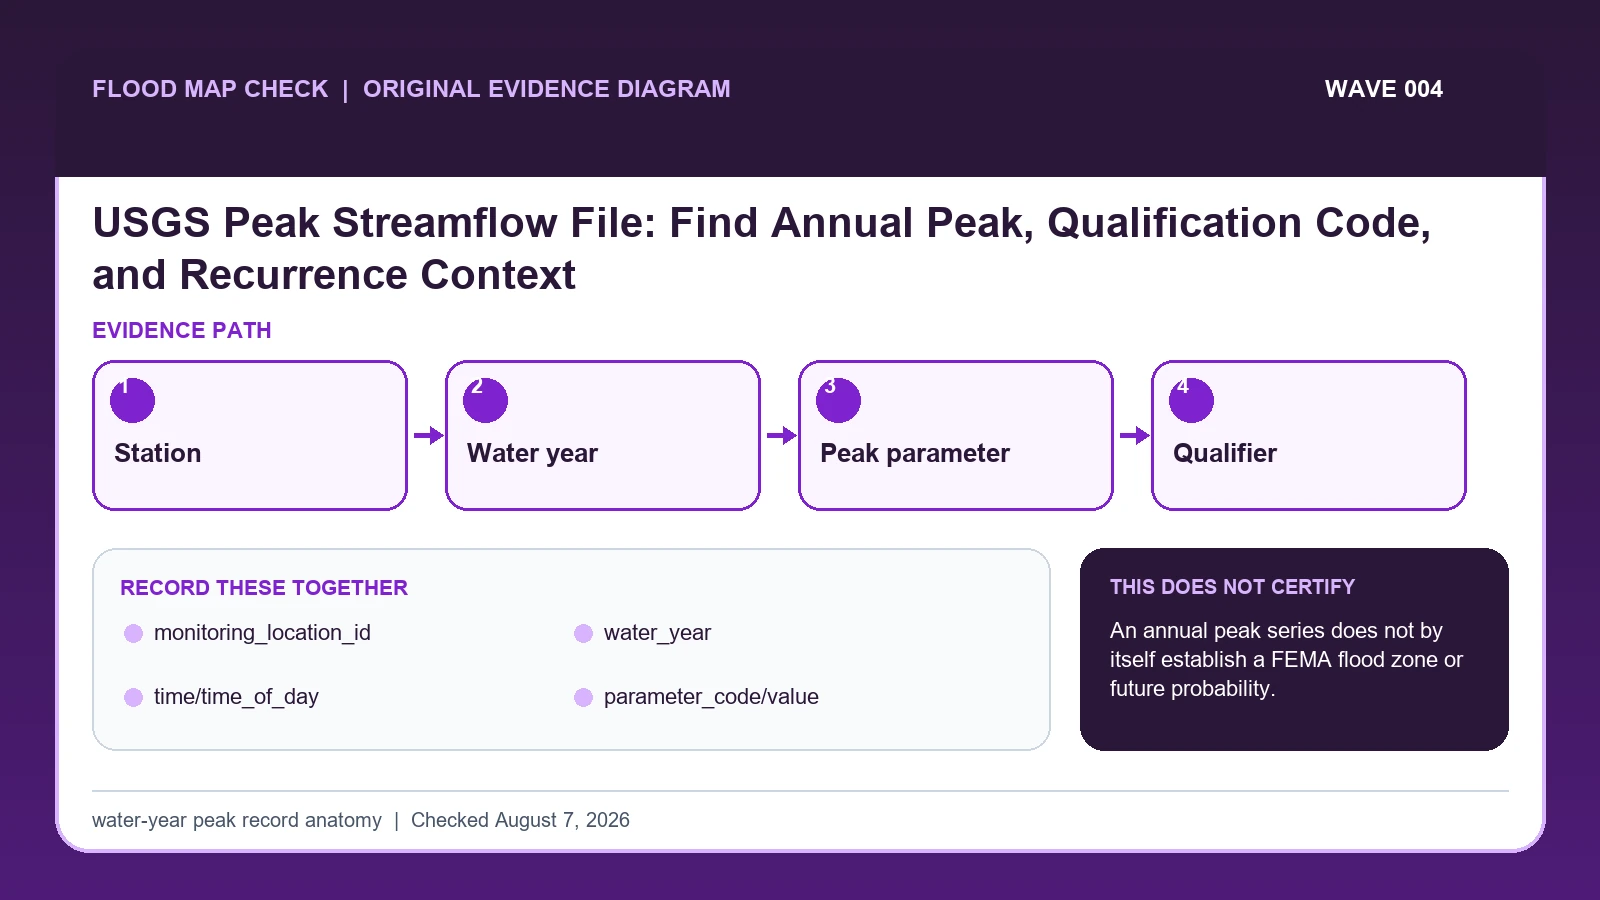
The USGS annual peak file reports the maximum instantaneous streamflow for a monitoring location in each water year, which runs from October 1 through September 30. Keep station ID, water year, peak time, parameter, value, units, qualifiers, peak-since information, and approval context; peak flow and peak gage height may occur at different times.
Last checked: August 7, 2026.
Annual peaks compress a year of observations into a flood-frequency record. The new USGS Water Data API exposes discharge and gage height as separate features identified by parameter codes, rather than assuming both belong in one row. Backwater, tidal fluctuation, ice, rating limits, or measurement circumstances can cause the maximum height and maximum discharge to diverge.
Water year, peak rank, and qualifier change the analysis
The annual peak file records a selected peak discharge for a water year at a station, with dates, gage heights, qualifiers, and station history as available. A water year runs from October 1 through September 30 and is named for the calendar year in which it ends. Sorting by calendar year can therefore place an October flood in the wrong analytical year even when the date itself is copied correctly.
A recurrence analysis begins after the record is screened. Keep station number, parameter, water year, peak date, discharge, gage height, codes, and qualification notes. If a station has 50 complete annual peaks, the largest value has plotting position roughly 1 divided by 51 under a simple Weibull ranking, or about 0.0196 annual exceedance probability. That illustrative calculation is not an official flood-frequency estimate and does not replace Bulletin 17 methods or station-specific review.
Partial years, historic peaks, regulation, urbanization, datum changes, and peaks known only to exceed a threshold can affect interpretation. A peak-since code can extend contextual knowledge without becoming an ordinary measured annual value. Do not discard qualifiers to make a clean chart. State the inclusion rule and period of record, and keep instantaneous event peaks separate from daily means and FEMA regulatory elevations.
USGS peak records and field definitions
USGS Water Data OGC API documentation supplies current peaks and monitoring-location collection definitions and query fields; this guide cites it for monitoring_location_id. USGS peaks API migration guide supplies annual-peak field names, parameter codes, qualifiers, dates, and peak-since values; this guide cites it for water_year / time/time_of_day / parameter_code/value / qualifier/peak_since. USGS Water Data for the Nation supplies monitoring-location metadata, instantaneous values, daily values, peaks, and qualification codes; this guide cites it for monitoring_location_id / parameter_code/value / qualifier/peak_since.
The USGS peak streamflow data crosswalk keeps these assignments explicit: USGS Water Data OGC API documentation → monitoring_location_id; USGS peaks API migration guide → water_year / time/time_of_day / parameter_code/value / qualifier/peak_since; USGS Water Data for the Nation → monitoring_location_id / parameter_code/value / qualifier/peak_since. If monitoring_location_id or another named field is absent from its cited record, leave that fact unresolved and obtain it from the responsible official source instead of expanding a different citation beyond scope.
| Official record | What it actually supplies | Field used here |
|---|---|---|
| USGS Water Data OGC API documentation | current peaks and monitoring-location collection definitions and query fields | monitoring_location_id |
| USGS peaks API migration guide | annual-peak field names, parameter codes, qualifiers, dates, and peak-since values | water_year / time/time_of_day / parameter_code/value / qualifier/peak_since |
| USGS Water Data for the Nation | monitoring-location metadata, instantaneous values, daily values, peaks, and qualification codes | monitoring_location_id / parameter_code/value / qualifier/peak_since |
For this check, the cited evidence is limited to monitoring_location_id, time/time_of_day, and qualifier/peak_since plus the other fields named in the crosswalk. Record a changed or missing time/time_of_day value with the retrieval date before taking the action to build a qualified annual-peak series rather than copying the highest recent observation, then request clarification from its publishing agency.
How monitoring_location_id connects to qualifier/peak_since
| Field | Meaning in this check | Error it exposes | Response |
|---|---|---|---|
| monitoring_location_id | Agency and station identity | Must not merge nearby sites | Keep in every row |
| water_year | Oct 1-Sep 30 grouping | Differs from calendar year | Use as annual key |
| time/time_of_day | When peak parameter occurred | Height and flow can differ | Keep timestamp/zone |
| parameter_code/value | 00060 discharge or 00065 gage height | Separate physical quantities | Do not combine blindly |
| qualifier/peak_since | Quality or historical context | Changes interpretation | Publish beside value |
Read the table in two passes. First confirm monitoring_location_id, water_year, and time/time_of_day. They answer “Agency and station identity”, “Oct 1-Sep 30 grouping”, and “When peak parameter occurred”. Any disagreement among monitoring_location_id, water_year, and time/time_of_day should remain visible rather than being blended into one result.
Next test for two different problems: “Must not merge nearby sites” and “Height and flow can differ”. They require different corrections. For the first, follow “Keep in every row”; for the second, follow “Keep timestamp/zone”.
parameter_code/value and qualifier/peak_since show when to stop. The warning conditions are “Separate physical quantities” and “Changes interpretation”. The limits on parameter_code/value and qualifier/peak_since keep the evidence useful without making the broader decision reserved for the named authority or professional.
Screen the annual series before frequency work
The order matters most around time/time_of_day. First, “Separate discharge and gage-height features by parameter code”. Next, “Group and label by water year, not by the year printed in the calendar date alone”. Reversing those actions can attach a sound interpretation to the wrong date, place, product, or case for time/time_of_day.
- Select the exact monitoring location and review station history before requesting peaks.
- Query the current peaks collection and preserve the API URL or filter.
- Separate discharge and gage-height features by parameter code.
- Group and label by water year, not by the year printed in the calendar date alone.
- Retain timestamps, units, qualifiers, peak-since fields, and approval metadata.
- Check station moves, datum changes, rating limitations, and gaps before comparing ranks.
- Use approved series and accepted flood-frequency methods for design or regulatory work.
End with “Use approved series and accepted flood-frequency methods for design or regulatory work”. That preserves qualifier/peak_since beside the source and date instead of leaving a detached number, color, category, or status that another reader could overinterpret.
A water-year peak ranked without discarding its qualifier
For water year 2025, the peak date can fall in October 2024. Grouping by calendar year would put that observation in the wrong analysis. If a discharge peak has a qualifier or a 'peak since' statement, retain both; dropping them can make a limited or estimated extreme look like an ordinary measured annual maximum.
In this example, monitoring_location_id identifies the relevant record, while time/time_of_day is the fact most likely to change the interpretation. Conclude “Annual maximum instantaneous flow” only when the evidence shows “Parameter 00060”.
For USGS peak streamflow data, if the facts instead fit “Partial record”, the result changes to “Rank is not full-history rank”. Respond by following “State record window”. Do not substitute the more favorable conclusion from the earlier example.
Complete annual peak, partial year, historic code, and regulated record
| Observed state | Evidence test | Limited conclusion | Next response |
|---|---|---|---|
| Discharge peak | Parameter 00060 | Annual maximum instantaneous flow | Use with qualifier and rating context |
| Gage-height peak | Parameter 00065 | Annual maximum stage | May occur at another time |
| Qualified peak | Code or note attached | Not a plain observed maximum | Explain or filter by stated rule |
| Partial record | Peak-since/period limits apply | Rank is not full-history rank | State record window |
Use “Parameter 00060” to recognize “Discharge peak”. If the facts instead meet “Parameter 00065”, report “Annual maximum stage” and follow “May occur at another time”.
If the observation matches “Code or note attached”, stop at “Not a plain observed maximum”. If it matches “Peak-since/period limits apply”, stop at “Rank is not full-history rank”. The corresponding actions are “Explain or filter by stated rule” and “State record window”.
Partial years, historic peaks, and regulated flow
- Avoid using calendar year. Recheck water_year. The mapped warning is “Differs from calendar year”; the corresponding response is “Use as annual key”.
- Avoid merging peak stage with peak flow. Recheck time/time_of_day / parameter_code/value. The mapped warning is “Height and flow can differ; Separate physical quantities”; the corresponding response is “Keep timestamp/zone; Do not combine blindly”.
- Avoid discarding qualifiers. Recheck qualifier/peak_since. The mapped warning is “Changes interpretation”; the corresponding response is “Publish beside value”.
- Avoid calling a partial-record peak all-time record. Recheck qualifier/peak_since. The mapped warning is “Changes interpretation”; the corresponding response is “Publish beside value”.
The remedy for “using calendar year” is tied to water_year: “Use as annual key”. The separate mistake “merging peak stage with peak flow” is exposed by “Height and flow can differ; Separate physical quantities”; answer it with “Keep timestamp/zone; Do not combine blindly”.
Check qualifier/peak_since when the risk is “discarding qualifiers”, because the mapped warning is “Changes interpretation”. Check qualifier/peak_since separately for “calling a partial-record peak all-time record” and use “Publish beside value” as the recovery step.
What this water-year peak record anatomy cannot decide
Scope: United States observed and forecast river conditions. Limitation: An annual peak series does not by itself establish a FEMA flood zone or future probability.
This comparison can expose a conflict between monitoring_location_id and time/time_of_day, but it cannot resolve “Partial record”. In that condition, the defensible next step remains “State record window”.
Keep annual peaks apart from instantaneous and daily values
- Carry the verified monitoring_location_id to River Flood Risk Check if that linked topic is the reader’s next question.
- Keep time/time_of_day attached to its source when moving to USGS Streamstats Flood Frequency Report.
- Treat USGS Flood Event Viewer High Water Marks as a separate review triggered by qualifier/peak_since while working to build a qualified annual-peak series rather than copying the highest recent observation, not as confirmation of the result here.
Use this guide to build a qualified annual-peak series rather than copying the highest recent observation. The linked guides address separate questions raised by monitoring_location_id, time/time_of_day, or qualifier/peak_since.
Before using the peak file for recurrence claims
Does monitoring_location_id settle the question by itself?
No. monitoring_location_id answers “Agency and station identity”, but it can fail when “Must not merge nearby sites”. Pair it with water_year, time/time_of_day, and the checked date.
What if the evidence shows Partial record?
Confirm the stated evidence test: “Peak-since/period limits apply”. The limited conclusion is “Rank is not full-history rank”. The documented response is “State record window”; a more favorable branch should not be substituted.
When should qualifier/peak_since be checked again?
Refresh the series when USGS adds a water year, approves a provisional peak, changes a qualifier, or corrects a historic or regulated-flow note. Keep the version used for any recurrence analysis so a changed record can be traced to the exact annual-peak row.
USGS Peak Streamflow File: Find Annual Peak, Qualification Code, and Recurrence Context is independent public-record guidance for the limited action to build a qualified annual-peak series rather than copying the highest recent observation. The cited government records retain authority over monitoring_location_id and qualifier/peak_since. Last checked: August 7, 2026.